
How to Navigate Your Online Platform Dashboard
Implementing new fleet technology, and managing the associated data shouldn't be stressful. We do our best at SureCam to ensure ease of use for our products, which means making sure we have the best resources available to help you manage your fleet data.
If you find yourself needing a refresher on how to track your vehicles, how to set up alerts, how to review video footage, or have general questions on how to navigate SureCam View/View Pro our Quick Start Guide can help.
Topics covered in the guide include:
View/ View Pro Guide
Logging In
Overview Homepage
Overview Page Functions: Map Tools
Overview Page: Drilling Down Into Vehicle Data
Vehicle Activity Report Customization
Vehicle Alerts
Vehicle Events
Side Navigation Overview
Side Navigation Overview: Alerts
Side Navigation Overview: Trip Replay
Viewing Video
Defined Zones
Defined Routes
Reporting
Report Customization
Scheduling Reports
View Pro Features Guide
View Pro Additional Feature Guide
Sorting and Filtering Data in Analytics Charts
View/View Pro User Guide
Logging into the platform
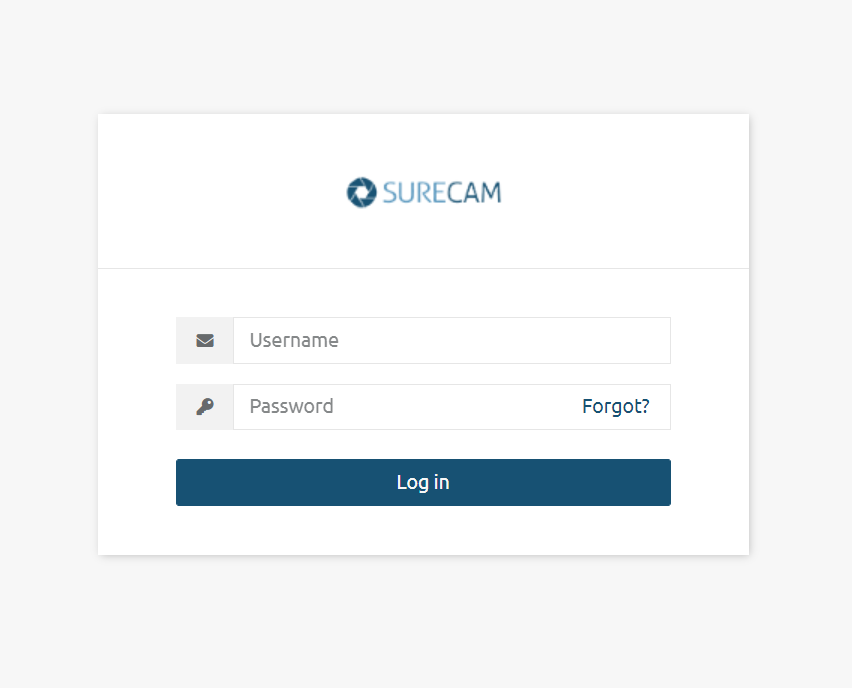
Users should log into the platform using the following link: https://track.surecam.com/
You will be taken to the following screen where you can use the login credentials provided by your SureCam Support Representative to access your account.
If you are having issues logging into your account, or need assistance retrieving your login information, check out our password reset guide.
Homepage Overview
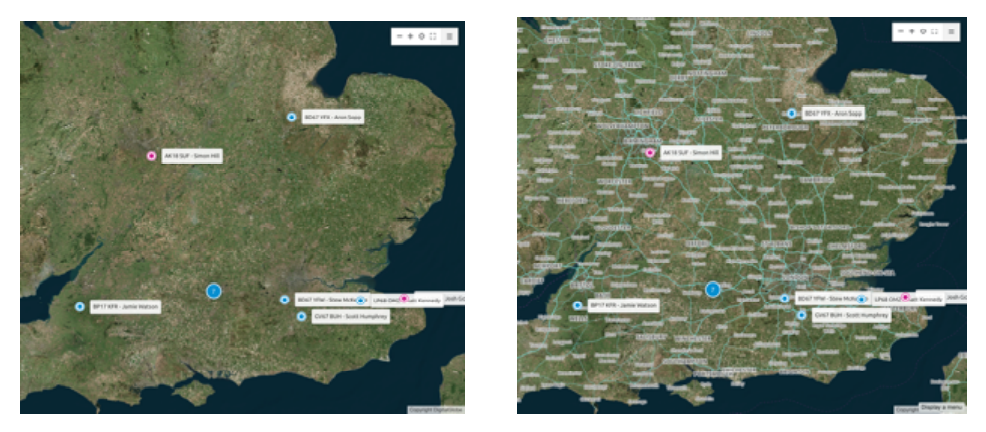
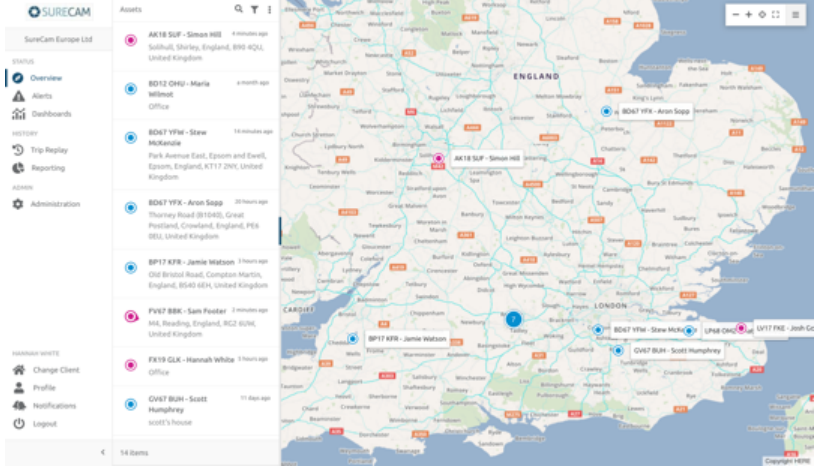
After logging in, you will be taken to the following home page where you can view real-time logistical data of your Vehicle Assets with a ‘Streets’, ‘Hybrid’ or ‘Satellite’ view.
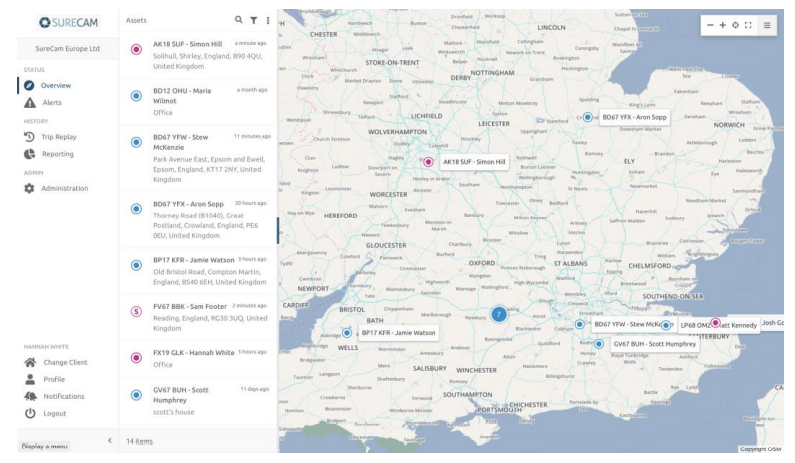
Selecting the "map view" will allow you to view your vehicle assets in real-time.
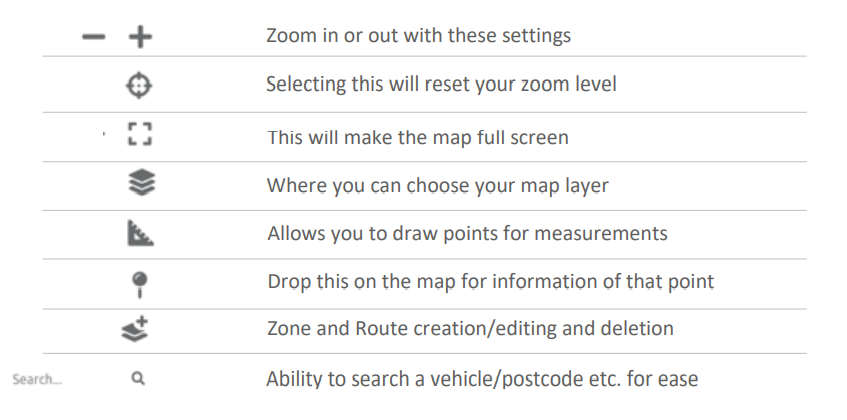
Overview of Page Functions: Map Tools
At the top right corner of your map view, you will see the Map Tools Menu. These icons, shown below, will help you navigate your platform. Select the four corners on the far right to expand the icon menu. Icon functions are outlined below.
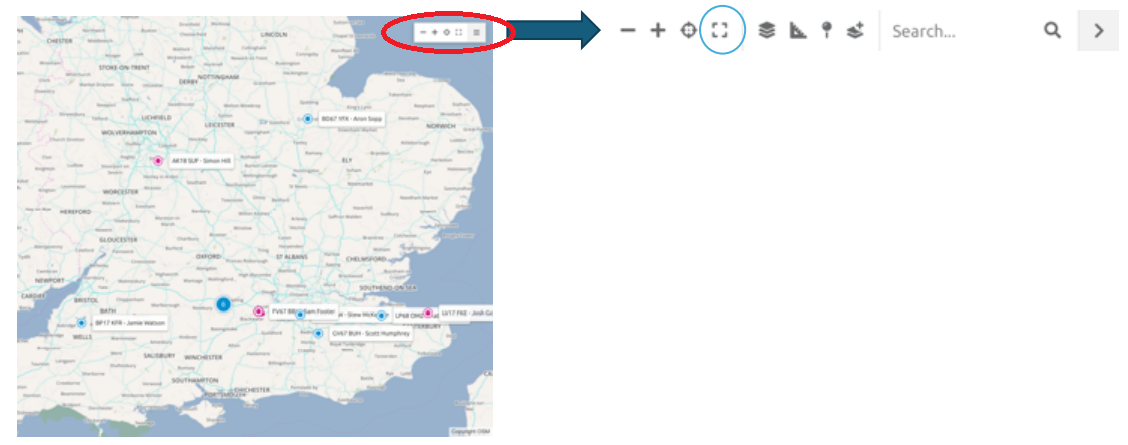
Map Icon Functions
Overview Page: Drilling Down Into Vehicle Data
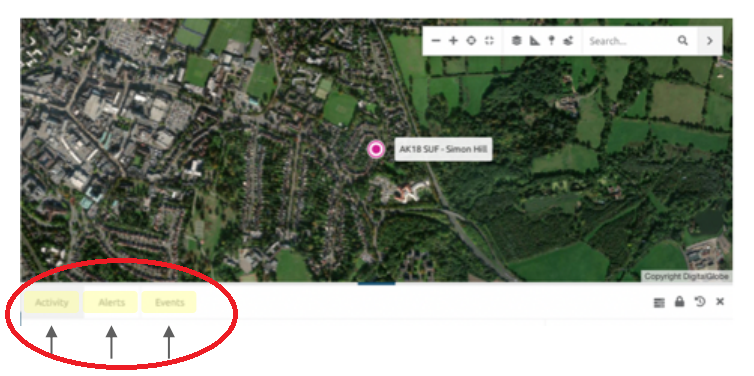
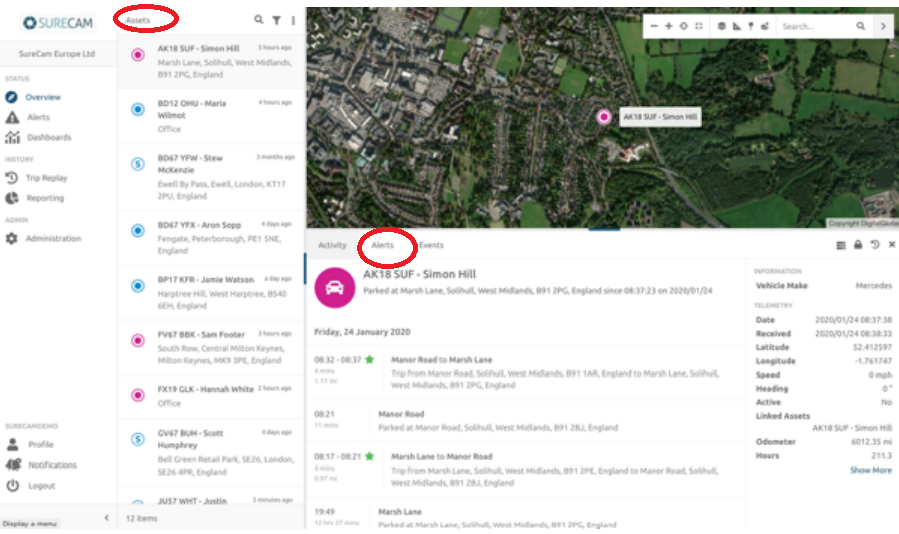
When viewing an asset from the Overview page, there are three tabs that house data tied to the vehicle you are viewing: Activity, Alerts, and Events. These tabs are highlighted below.
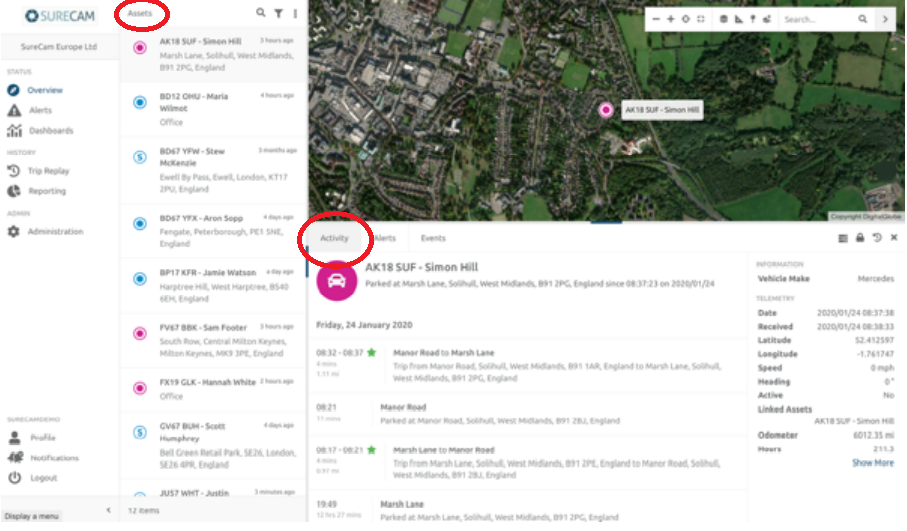
Activity Tab
The activity tab allows you to review the trip activity of any vehicle in your fleet. To do this, click on the specific vehicle of interest from within the 'Assets' list available on your Overview screen. This will focus the map view on that selection, showing the location along with the current tip and recent trip activity
listed in the ‘Activity’ tab.
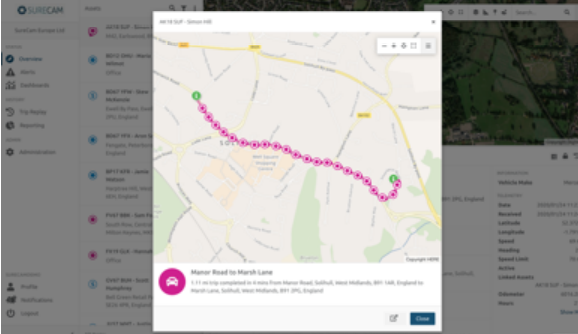
To drill down to an individual trip, select the trip of interest from the list of ‘Activity’ and it will open a new window with breadcrumb level trip details.
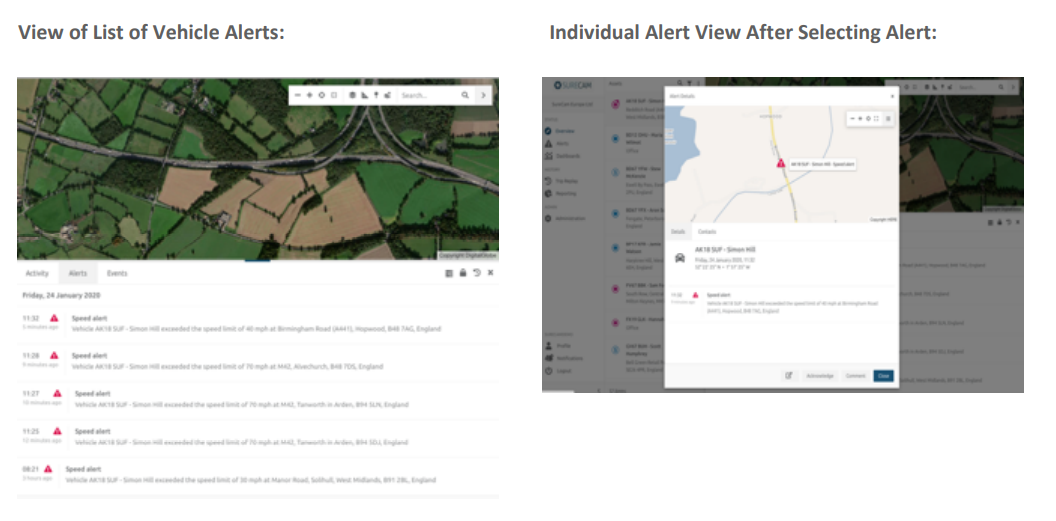
Vehicle Alerts
From the Overview tab, you can drill down directly into individual vehicle alerts. To do this, click on
the specific vehicle of interest from within the ‘Assets’ list available on the Overview page. Click on
the ‘Alerts’ tab to see a listing of alerts triggered by your vehicle of interest.
Standard Alert Setup:
• Low alert for harsh acceleration
• Low alert for harsh braking
• High alert for when a vehicle creates a video
• High alert when a vehicle exceeds the speed limit by 10MPH
Vehicle Events
The Events tab will list all the triggered events for the vehicle including Vehicle On, Vehicle Off, and
speeding events.

Side Navigation Overview
SureCam View/View Pro is designed to get you to your data points of interest in as few clicks as possible. Fleet-level navigation takes place using the side navigation menu as seen in the image below.
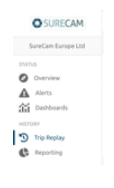
Available within SureCam View: Overview, Alerts, Trip Replay, Reporting
Available within SureCam View Pro: Overview, Alerts, Dashboards, Trip Replay, Reporting
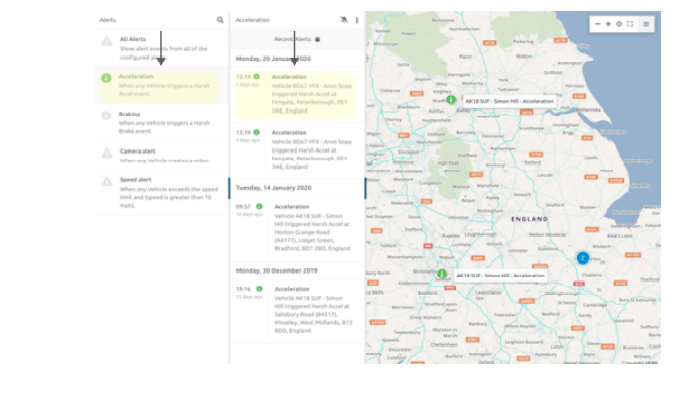
Side Navigation Overview: Alerts
Selecting Alerts from the side navigation menu, you will access a view of all alerts that have been
recorded across your fleet. You can select the specific Alert Type of interest to list all alerts received of that type across your fleet, e.g., selecting ‘Acceleration’:
Side Navigation Overview: Viewing Video
You can find a list of all triggered High Incidents and Button Press videos within the ‘Alerts’ section of the ‘Status’ pane in the Side Navigation Menu. When viewing alerts in this section, select ‘Camera Alert’. From here, you can click on the videos of interest by selecting the desired date and scrolling through your options.
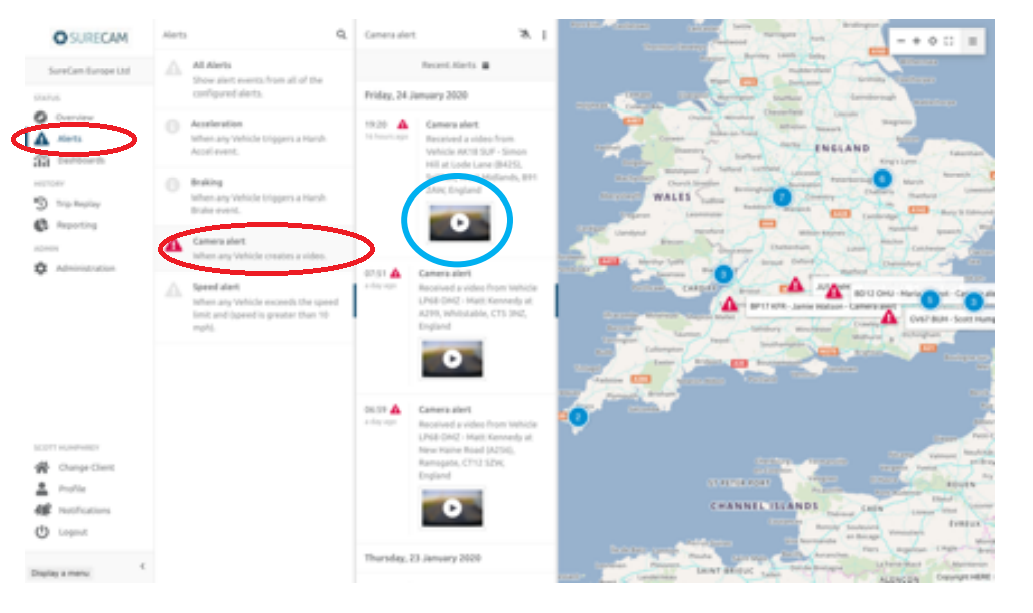
Click on the play symbol within the listing of ‘Camera Alerts’ to open a window to view the captured footage.
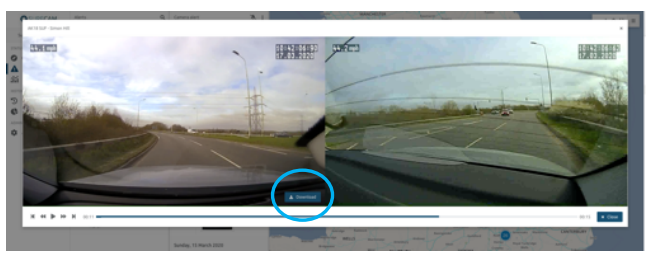
Downloading Video
If you hover over a video, in the bottom right corner of the footage itself ‘Download’ will appear. Click on the ‘Download’ button to save this footage directly onto your PC/device.
Side Navigation Overview: Trip Replay
Selecting Trip Replay from the side navigation, you will be able to drill down into trip details
identified by a point in time.
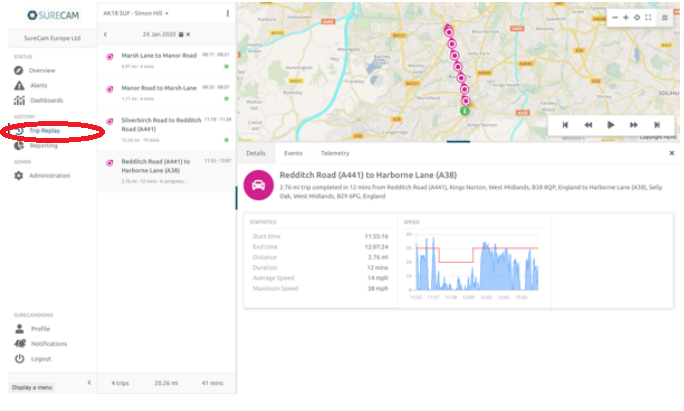
By working your way through the recent trips, selecting the asset/vehicle and date of interest will narrow the list to all trips for the vehicle on that date.
Clicking on a trip will display it in a breadcrumb map format, along with detailing such items as Duration, Distance, Timing, etc.
Defining Zones
Zones represent geographical areas of interest to your company that you would like to generate reports and alerts from. Zones can be created directly on the map within the Overview screen.
How to Create a Zone:
To create a Zone, open the toolbar on the map and choose ‘Draw a zone polygon’ under the ‘Add layer’ option. This now changes the mouse into the cursor. Click on the map to add the first point of the polygon:
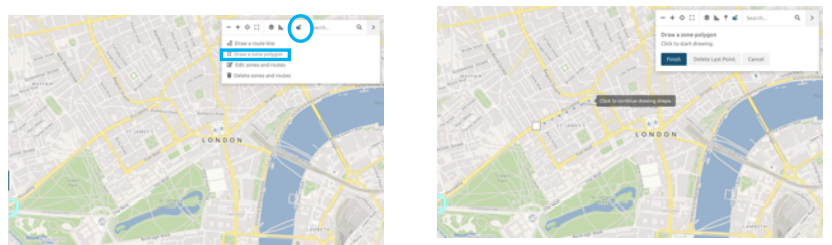
Click on the map at the desired points until satisfied with the shape. If a point is added in the wrong place, simply click ‘Delete Last Point’ and continue.
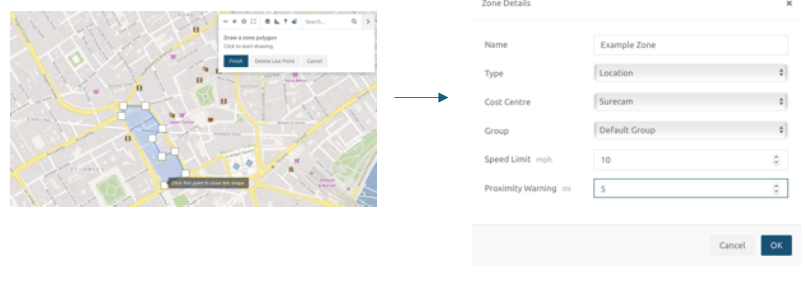
When finished, click on the first point to complete the creation. A pop-up will appear. Fill in the relevant details to save the newly created zone.
Defined Routes:
The platform supports the creation of Routes, directly within the map on the Overview or Trip Replay sections.
There are two ways to create Routes, the first is by using the pin tool on the toolbar of the map and the other is from an address search entered.
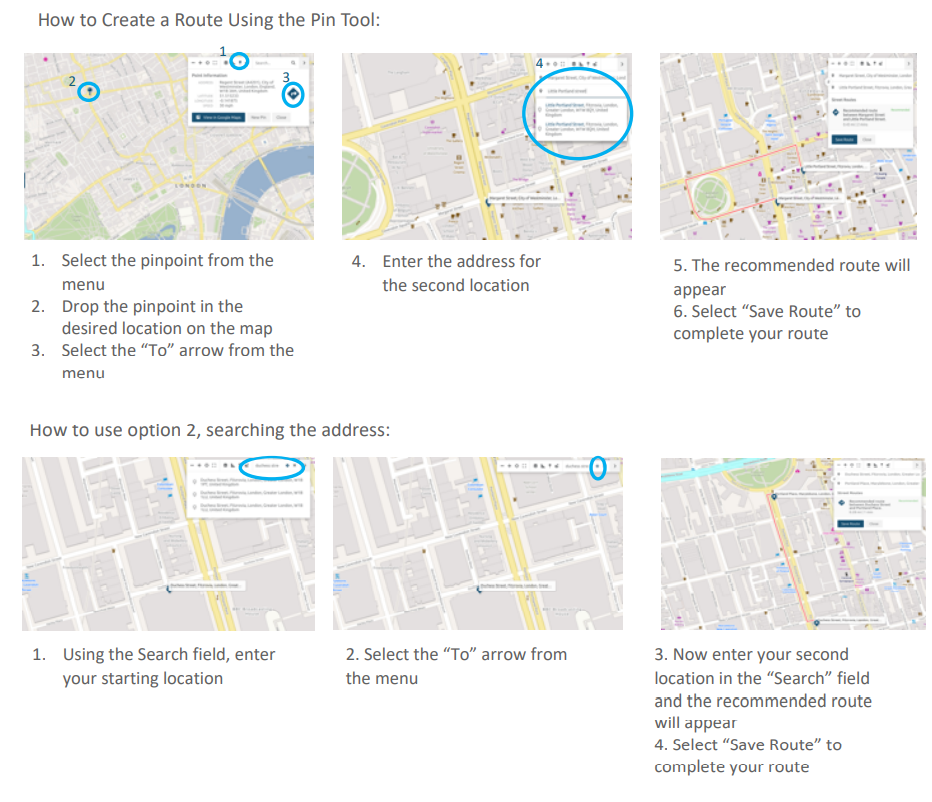
How to Create a Route Using the Pin Tool:
Reporting
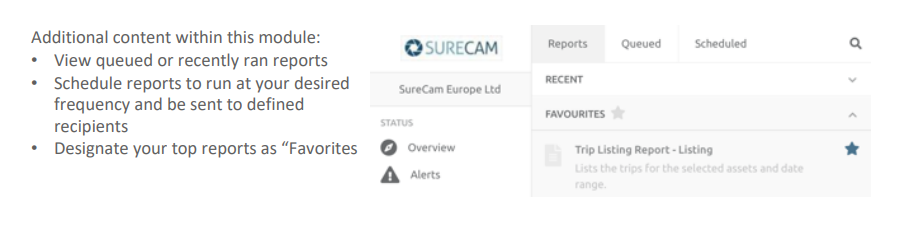
A list of accessible reports is available from the “Reporting” section of the Side Navigation Menu. Through the reporting functionality, you can report on all assets/vehicles within a fleet, report on vehicles within a defined Cost Centre, or even on individual selected assets.
SureCam View users have access to: Alert Report, Event Report, Trip Report, Stop Report
SureCam View Pro users have access to: Alert Report, Event Report, Trip Report, Stop Report, Rating Report, Location Report, Speed Report, Zone Report, Analytics Report Pro Suite
Definition:
- Alert Report – Analyze and report on the tracking alerts that matter most to your fleet, including
Maximum-Speed-Limit, Harsh Driving, Camera Alerts, Zone Breaches, and Route Deviations. - Event Report – Report on fleet activity including ignition starts, Zone activity, and maximum speed-limit occurrences.
- Trip Report – View a round-up of the trip activity made by selected vehicles within a given date
and time range. - Stop Report - View a round-up of any stops made by selected vehicles within a given date and
time range. - Rating Report (Pro) – Analyze the performance of your overall fleet, defined groups and
individual drivers using harsh driving, speeding, distance and duration data to provide a rating
score. - Location Report (Pro) – Get a snapshot listing of the current location of all your vehicles.
- Speed Reporting (Pro) – Report on posted speed limit violations within the overall fleet, defined
groups and by individual vehicles. - Zone Reporting (Pro) – Report on the time spent and distance covered in a Zone by vehicles or
zone. - Analytics Report Pro Suite - Create visualizations of your fleet data used to populate your custom
configured dashboards.
Report Customization
How to Generate Reports
Once you have chosen your desired report, click to open and select your preferences. Click “Run”
when done to populate your report.
The following options can be selected to customize your report:
- Output Format – Choice of PDF, CSV, CSV (Formatted) and XML
- Mode – Make no selection here
- Date Range – Predefined options for quick reporting with the flexibility to customize
- Asset Filter – Typable field, where you can search for a specific asset, alternatively by typing ‘Any
- Vehicle’ or ‘Any Vehicle in Cost Centre *Name*, you can narrow the report to the relevant assets
- Minimum Distance – Reported in miles, this field is editable to filter the data results
- Page Break – Default ‘None’ alternative option of ‘Group’
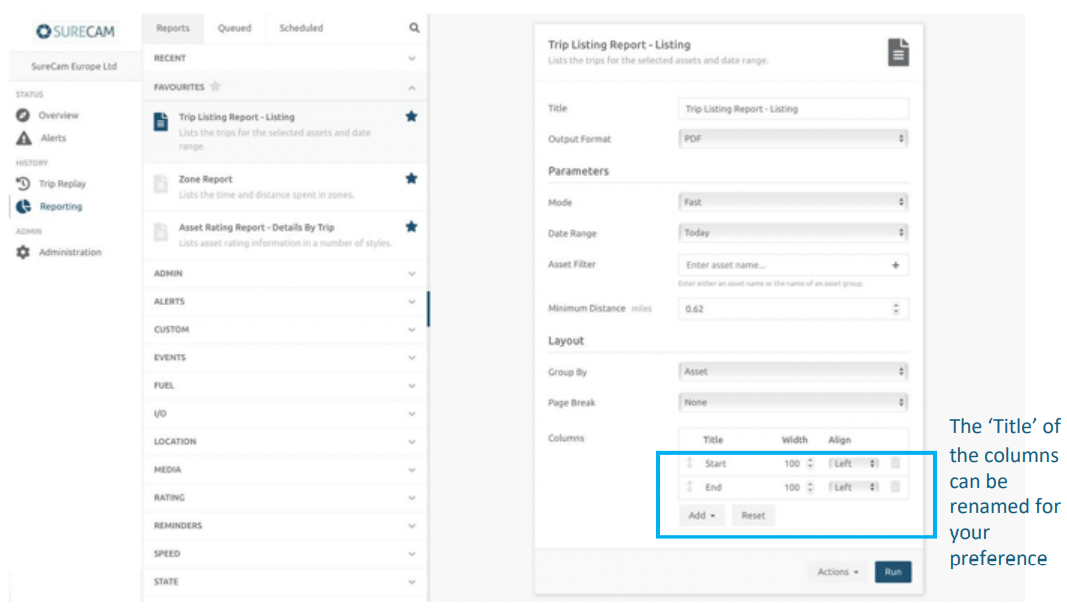
- Columns – By selecting ‘Add’ or clicking the Delete icon, you can add and remove data from the report
- Format – Choose between ‘Listing’ or ‘Summary’ to select your desired amount of data/format
- Group By – Select your preferred view of data by grouping by ‘Asset’ or ‘Date’
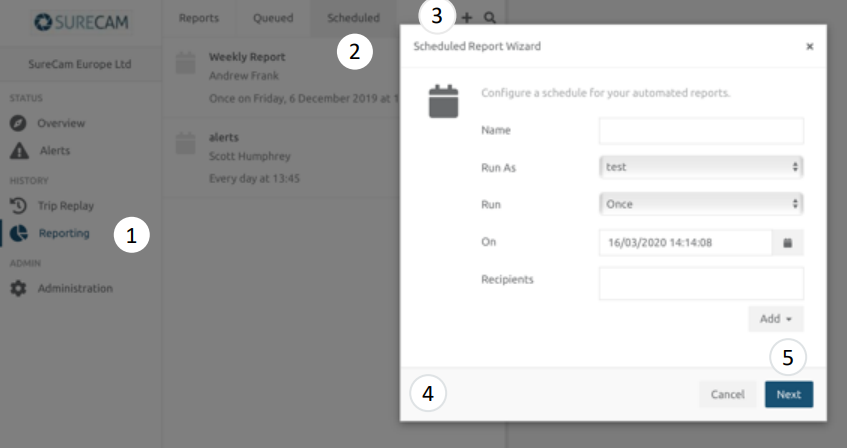
Scheduling Reports
How to Schedule a Report:
- Navigate to the Reporting module from the Side Navigation Menu.
- Click on the “Scheduled” tab
- Click the “+” button
- Fill in the Scheduled Report Wizard as prompted to create a unique schedule
- Click “Next” to create the schedule as an available schedule within your list
How to Add a Report to a Schedule
- Choose the report you would like to add to the schedule and complete the parameters for
that report. - When you have chosen all the relevant report parameters, click “OK” to have the report
appear in the schedule. - To add another report, click the “+” button on the right-hand side of Reports and complete
the procedure as outlined above.
SureCam View Pro Additional Feautres
What additional features are included with SureCam View Pro?
The SureCam View Pro map enables more functionality with the use of contextual speeding, dynamic zone reporting, and the introduction of the Rating Report.
Contextual Speeding
Contextual speeding compares the traveling speed of your vehicles with the posted road speed limits, allowing you to report on contextual speeding violations.
Dynamic Zone Reporting
Report on a variety of activities and events that occur within Zones, including time spent in zones and speeding violations within zones,
Rating Reports
Generate reports that rate the performance of your vehicles or drivers relative to the rest of your fleet.
Dynamic Zone Reporting
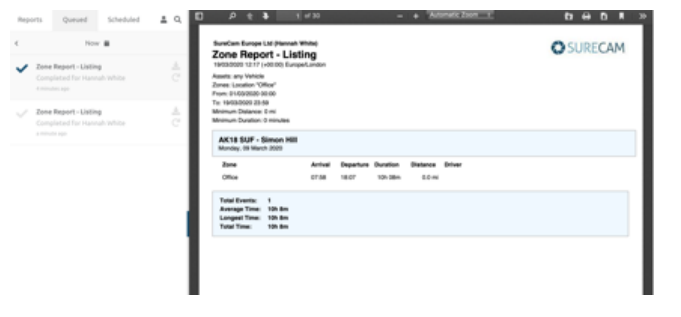
Zone Reporting is available in SureCam View Pro and can be found under the Reporting module available from the Side Navigation Menu.
These reports pull data from activity within the Zones that are created in your account. The Zone Report can be used to oversee where the assets have been within a chosen timeframe as well as the duration of time spent within the selected Zones.
Dashboards
To view a list of dashboards currently created within your account, click on the Dashboard module from the Side Navigation Menu. Your available dashboards will appear in the Open Dashboard section of the screen for you to select from.
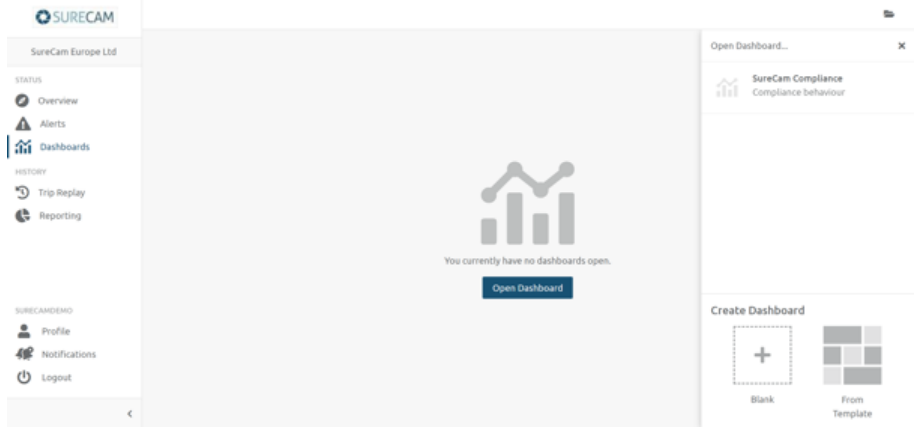
How to Create a Dashboard
To create a new Dashboard, follow the above steps, then click on the ‘+’ from the ‘Create Dashboard’ section of the screen. This will open the Dashboard Wizard. Complete the necessary fields:
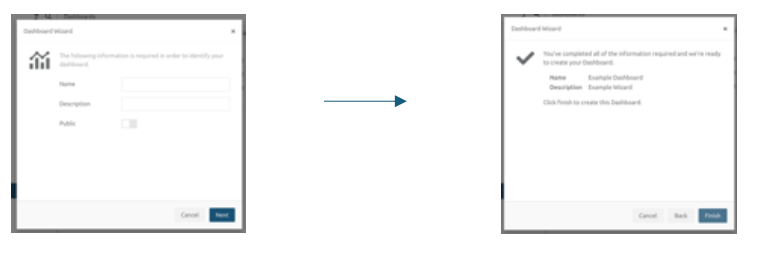
Now you have the Dashboard canvas set up, it is ready for your report widgets. You can start creating live report widgets via the Analytics Reporting section of the Reporting module. You can choose from nine customizable reports, all with the ability to view the data in a chart, pie, or stat format.
ANALYTICS REPORT PRO SUITE
The platform contains a pre-defined list of Analytics Reports that you can run. These reports can be viewed and exported as a PDF or CSV file. The Analytics Reports can also be displayed in Chart, Pie or Stat format on your Dashboards.
Dashboards can be updated in real-time to display live data or given an updated time frame to display the data at the interval of your choice.
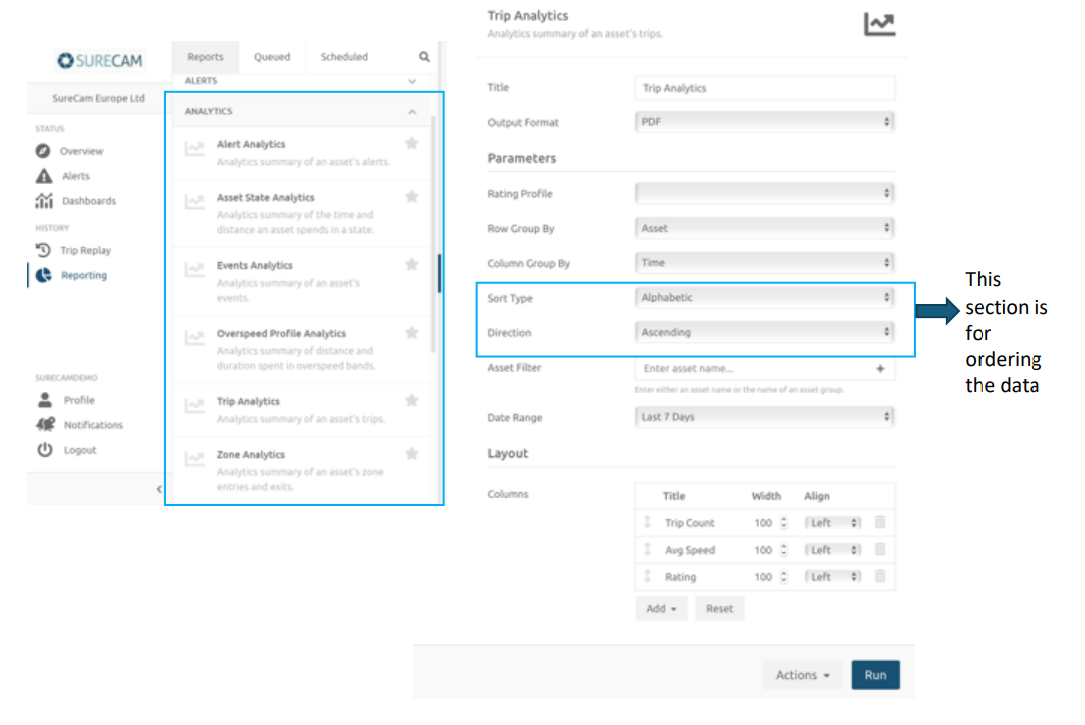
How to Run an Analytics Report
The Analytics Reports are grouped under the section ‘Analytics’ within the Reporting Section. They function the same way as other reports in SureCam View Pro. Choose the report you would like to run and edit the parameters accordingly.
Available Analytics Reports
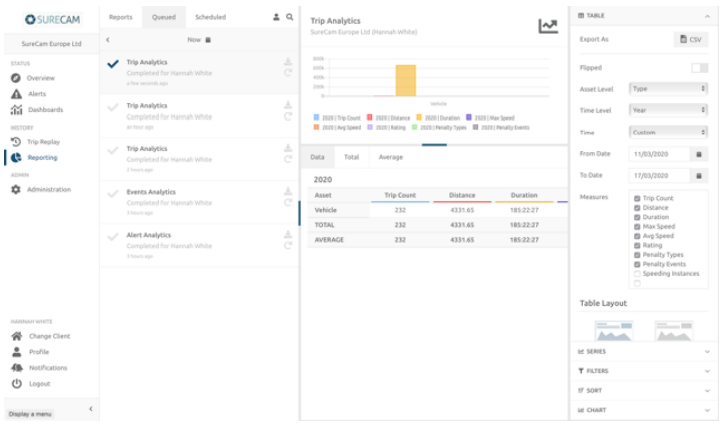
Once you have decided what data to keep in the chart, you can choose to either deselect the unnecessary data fields in the Measures section or click the name of the field in the Legend.
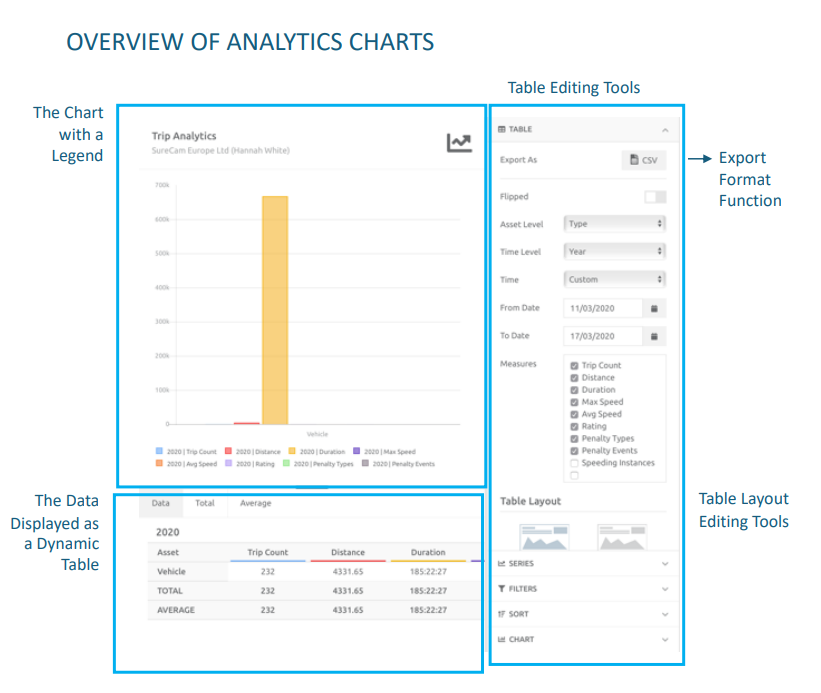
Editing an Analytics Chart
The Analytics charts can be edited in multiple ways giving you a variety of options for displaying your data.
You can adjust the Asset Level, Time Level, Time, Measures and Table Layout options in the Table Menu. Below you will see the first output of a chart after running a report. No columns were removed when running this report.
Sorting and Filtering Data in Analytics Charts
You can change the way you have sorted the data within the ‘Sort’ menu option, along with filtering the data.
For example if there was an asset not required within the results you can remove assets by unchecking that asset’s name. You an also filter on ‘Date’.
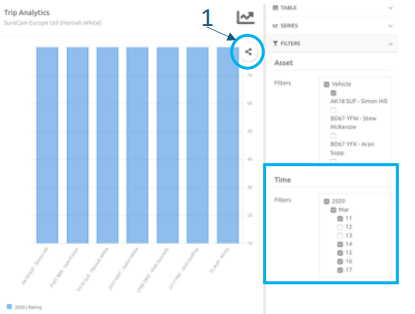
Once you are happy with your chart, you can share it to a Dashboard. The share option appears on the chart when you move your mouse over the chart itself (1 – Above).
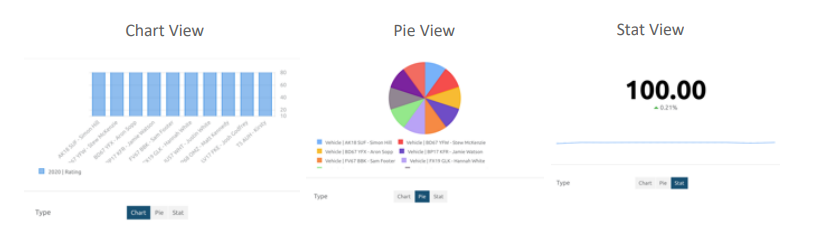
A window will be displayed where you can select the Dashboard in which you would like to display the report widget. Name the report widget and provide a description. Choose whether you would like your chart to be displayed as a Chart, Pie or Stat view.
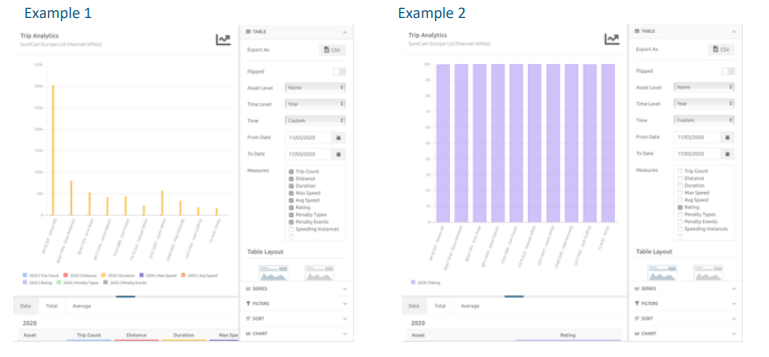
Analytics Charts Examples
Example 1: A chart with only item changed. ’Name’ was chosen for Asset Level.
Example 2: A chart showing the data with some data fields removed from the chart by deselecting the options within ‘Measures’. You can select/deselect to your preference.
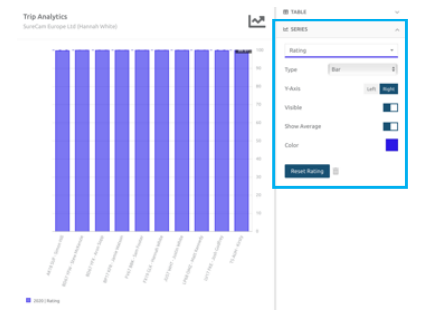
Clicking on the bar chart will navigate you to the ‘Series’ menu option, where you can edit the
display of data within the data series.
You can change the color, add in the average for the cohort and change the axis to display the data according to your needs.
For additional support accessing your online platform, reach out to Support at Support@SureCam.com (US clients) or CustomerServiceUK@SureCam.com (global clients). Download our full guide below: